
Internship report: K-Means clustering EWS data
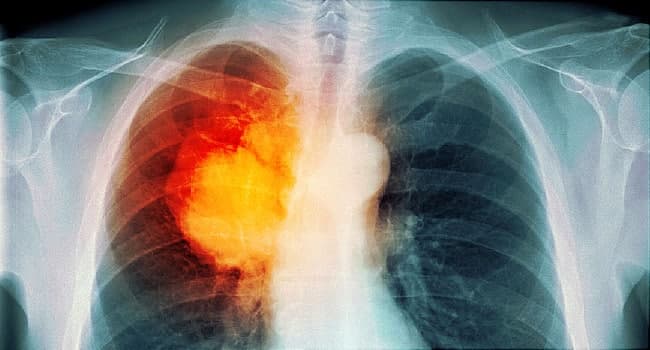
July 1st, 2020During an internship at Arinti, Senne (Erasmushogeschool Brussel) worked with an anonymised dataset of over 170,000 Early Warning Score (EWS) measurements. The EWS score aggregates vital parameters like heart rate, blood pressure, and body temperature to indicate a patient's overall condition.
From exploration to clustering
After data exploration in Python — visualising distributions, filtering healthy vs unhealthy data, and identifying boundary zones — the project moved to K-Means clustering. The algorithm took patients with 100+ measurements, extracted their 87 most recent EWS values, and assigned cluster labels based on health trajectory trends.
Dashboard and results
An Angular web dashboard displayed monitoring data per patient, with colour-coded values for danger zones. The clustering results showed each patient's category with an explanation of what it means for their health outlook. This can help doctors and nursing staff assess patient condition and predict future trajectory. — Senne, Erasmushogeschool Brussel
Explore more
Internship report: Using AI to personalise medical questionnaires
Intern Usman Dankoly researched AI techniques to personalize PRO-CTCAE questionnaires for lung cancer patients, using K-means clustering and personalised recommendation scores to reduce questionnaire burden.
Internship report: Education Recommender Bot
Intern Brecht Noyens built a chatbot that recommends the best field of study to future students, combining Microsoft Bot Framework Composer with a Python-based recommendation engine on Azure.

Build your own image dataset with Bing Image Search API
A step-by-step Python guide for building your own image dataset using the Bing Image Search API, from search and download to storing results in Azure Machine Learning Studio.
